Track your localized market pricing performance in Shopify
TL;DR
Once Localized Market Pricing is enabled, you can use Shopify Analytics to track how it affects buyer behavior in each market. Monitor sessions, add-to-cart rates, conversion rates, and total revenue by country to see how localized pricing impacts performance.
Expect to see slightly fewer add-to-carts but higher-intent buyers—those who do engage are more likely to complete checkout once they see all-in pricing.
Why tracking matters
Localized Market Pricing changes how international shoppers experience your store. By including duties, taxes, and shipping upfront, you reduce surprise fees and build trust—leading to higher conversion and more predictable revenue per region.
Tracking these shifts helps you validate performance, compare across countries, and adjust your pricing rules with confidence.
Step 1 — Set up reports
For detailed instructions on Shopify Analytics read the Shopify Help Center articles. The following is a brief overview:
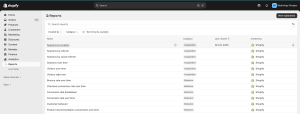
In your Shopify admin, go to Analytics → Reports.
Select Sessions by location over time, orders over time, Sales by market over time, or Checkout conversion by country over time.
Compare time periods of before Localized Market Pricing and after Localized Market Pricing.
Verify that your Markets in Shopify align with the active markets in FlavorCloud’s Localized Market Pricing setup.
Each enabled market (e.g., UK, Australia, Canada) should appear as a segment in your reports.
Optional: Create custom reports that combine traffic, add-to-cart, and conversion data for each Localized Market Pricing market.
Step 2 — Track add-to-cart and conversion rates

- In Analytics → Reports, open Conversion over time or orders over time.
- Filter by Market or Country to see how add-to-cart and checkout completion rates change. You can add multiple factors to a single report in order to see all information in one place, or keep reports seperate.
- Expect to see:
- A small drop in add-to-cart rate
- A larger rise in conversion rate and completed checkouts
Insight: Localized Market Pricing reduces low-intent activity, fewer casual adds, but higher conversion among serious buyers.
Step 3 — Review sessions
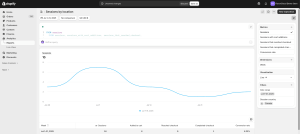
- In your Shopify admin, go to Analytics → Reports → Sessions by location or Sessions over time
- Filter by Country or Market to view how many shoppers are visiting from each region.
- Check that your Localized Market Pricing-enabled markets (like the UK, Australia, or Canada) are receiving consistent traffic.
- Look for:
- Steady or slightly reduced session counts
- Longer average session duration or more pages per session, indicating stronger purchase intent
- Improved conversion rate over time
Tip: Compare the last 30 days to the previous 30 days to spot early trends in traffic and conversion.
What to expect:
Traffic may dip slightly as window-shoppers drop off earlier, but remaining sessions are typically higher-intent and lead to better conversion.
Step 4 — Monitor revenue by market
- Go to Analytics → Reports → Sales by market.
- Compare total revenue, average order value (AOV), and conversion rate across Localized Market Pricing-enabled markets.
- Use the date filters to review results before and after enabling localized pricing.
- Watch for fewer refund or duty-related support issues, since taxes are now collected upfront.
Step 5 — Interpreting your results
| Metric | What to Expect | Why It Matters |
| Sessions by location | May stabilize or slightly decline | Fewer low-intent visitors; higher-quality traffic |
| Add-to-Cart Rate | Slight decrease | Price transparency filters out casual browsers |
| Conversion Rate | Noticeable increase | Buyers see full cost upfront and commit confidently |
| Revenue per Market | Stable or higher | Conversion gains offset fewer sessions |
| Refund / Duty Tickets | Drop | Taxes and duties handled at checkout |
Step 6 — Review and iterate
- Check reports weekly for the first 30–60 days after launch.
- Identify markets with the highest conversion lift and replicate similar inclusion settings in other regions.
- Adjust cost component selections (shipping, duty, tax, fees) or margin percentage in the FlavorCloud Markets page to fine-tune performance.
Saving Reports:
If you’re on Advanced or Plus, create saved reports for:
-
“Sessions by Location – Localized Market Pricing Markets”
-
“Add-to-Cart and Conversion – Localized Market Pricing vs. Non-Localized Market Pricing”
-
“Revenue by Market – Localized Market Pricing Performance”
This makes it easy to check week-over-week trends as localized pricing stabilizes.
If you’re on Shopify or Basic, you can:
-
Use Exports (CSV) weekly
-
Track those same metrics in a shared spreadsheet to compare before/after Localized Market Pricing rollout.
Example KPI targets (first 60 days)
| KPI | Target |
| Sessions | Within ±10% of baseline |
| Add-to-Cart Rate | Within ±10% of baseline |
| Conversion Rate | +5–30% increase |
| International Revenue
|
+10–20% increase overall |